
In this post, I will explain how you can monitor Angular apps using Microsoft Azure Application Insights.
It is not unusual for organisations to ignore monitoring single page applications. Usually, back-end applications such as APIs are monitored via logs, CPU and memory usage.
When it comes to front-end, there is usually not much in the way of monitoring.
Table of contents
Getting started with Application Insights
First of all, create your free Azure account here.
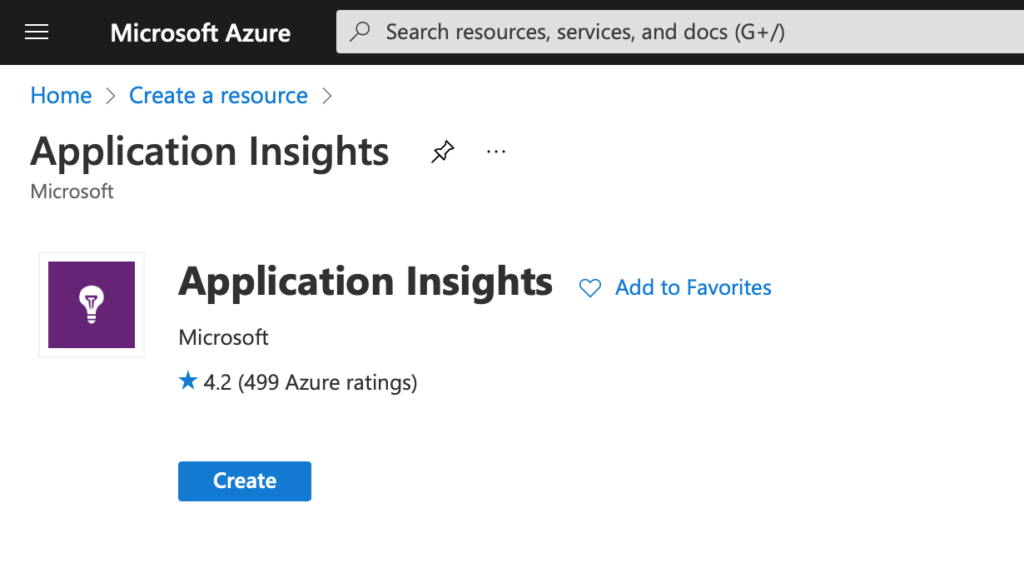
Head over to the portal to create a new resource. Search for ‘application insights’ and click Create.
It will take some time (usually a few seconds) to create the new Application Insights resource. Then, navigate to the resource and find your Instrumentation Key from the right hand side of the screen.
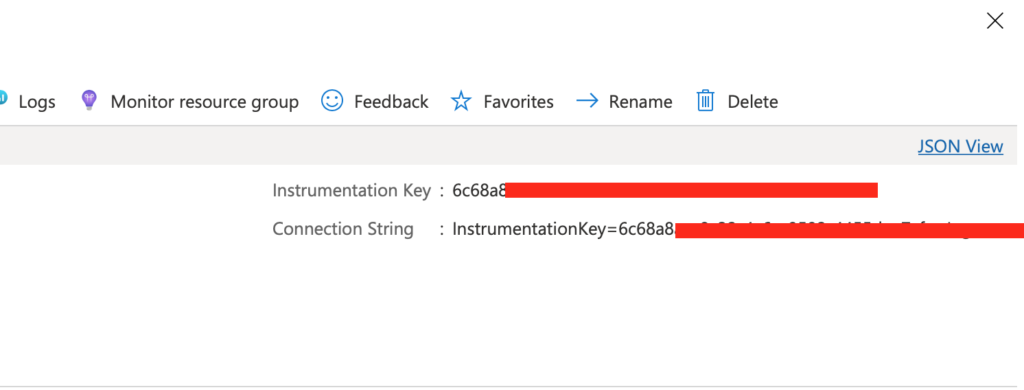
The instrumentation key uniquely identifies the resource you created on Azure. You can use this key with as many components as you wish, including APIs and front end apps.
Install npm package
Install the official package to your Angular application:
npm install @microsoft/applicationinsights-web@latestCode language: Bash (bash)This package includes all everything you need to start monitoring your Angular app.
Configure Application Insights
Initialise application insights in the root module of your app. If you have a core module, initialise it there.
// .. app.module.ts
 providers: [
    {
      provide: ApplicationInsights,
      useFactory: appInsightsFactory
    }
  ]

export function appInsightsFactory(): ApplicationInsights {
  const config: IConfig & IConfiguration = {
    instrumentationKey: environment.appInsightsKey,
    disableTelemetry: environment.appInsightsKey === "",
    enableCorsCorrelation: true
  };

  // send telemetry immediately for dev environment
  if (!environment.production) {
    config.maxBatchInterval = 0;
    config.maxBatchSizeInBytes = 0;
    config.loggingLevelConsole = 2; //log internal app insights errors to console
  }

  return new ApplicationInsights({ config: config });
}Code language: TypeScript (typescript)
Please import classes from @microsoft/applicationinsights-web namespace.
The factory method creates an instance of ApplicationInsights client. In addition, it sets the instrumentation key from Angular environment variables. This instance is a singleton, which helps us avoid duplicate telemetry collection.
Setting enableCorsCorrelation to true adds custom headers to each and every request issued by Angular application. These headers are used on the server to correlate requests end to end. If your server has a CORS configuration, be sure to allow the following headers:
"Access-Control-Allow-Headers", "traceparent, request-id, request-context"Code language: HTTP (http)The great thing about App Insights is that all telemetry is buffered and automatically sent to the Azure Portal when the user session ends i.e. browser tab is closed. This is especially useful in production environment as it does not impact user experience.
However, it can be annoying in development as you may need to wait or reload page to see data in the portal. That’s why I configure it above to immediately send telemetry in development environment.
Create a monitoring service
The configured ApplicationInsights instance in our application allows us to log messages, exceptions, track events, collect performance metrics and even custom events.
Creating a wrapper service will allow us to set common properties. For example, cloud role name and user identifier can be set on each telemetry item.
import { Injectable } from "@angular/core";
import { ApplicationInsights, SeverityLevel } from "@microsoft/applicationinsights-web";
import { environment } from "src/environments/environment";
@Injectable({ providedIn: "root" })
export class MonitoringService {
constructor(private appInsights: ApplicationInsights) {
this.appInsights.loadAppInsights();
this.appInsights.setAuthenticatedUserContext("USER_EMAIL");
this.appInsights.addTelemetryInitializer(envelope => {
envelope.tags = envelope.tags || [];
envelope.tags.push({ "ai.cloud.role": "MyApp.Web" });
envelope.data = {
environment: environment.id
};
});
}
logError(error: Error): void {
this.appInsights.trackException({ exception: error });
}
logInfo(message: string): void {
this.appInsights.trackTrace({ message: message, severityLevel: SeverityLevel.Information });
}
logPageView(componentId: string, url: string = window.location.pathname): void {
this.appInsights.trackPageView({ name: componentId, uri: url });
}
logEvent(name: string, properties: any): void {
properties.url = window.location.pathname;
this.appInsights.trackEvent({ name, properties: properties });
}
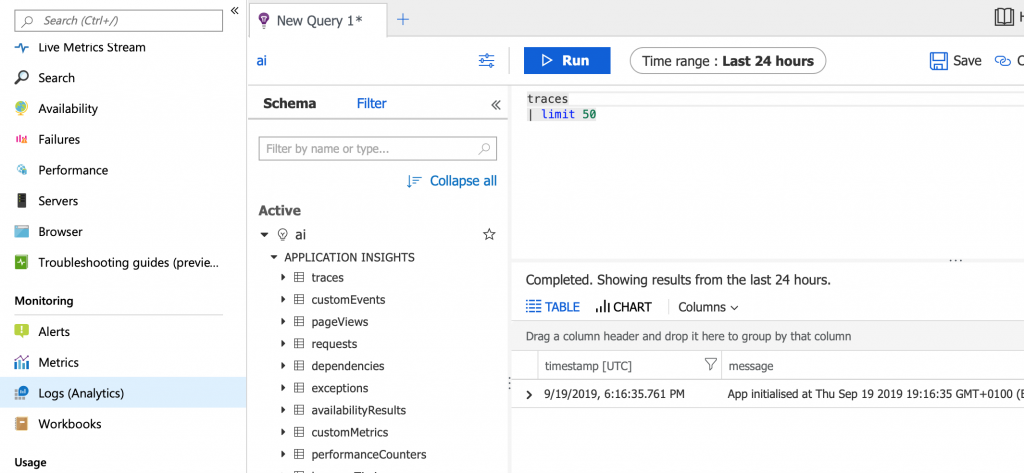
}Code language: TypeScript (typescript)Regardless of the severity level, all data logged with trackTrace will appear in the Traces section of Azure Logs. Each log is classified as trace but has a severity level associated, which you can see in the Azure Portal.
If you wish to only send error logs to Azure, you can add the following to configuration:
loggingLevelTelemetry: SeverityLevel.ErrorCode language: TypeScript (typescript)Monitoring from a component
With our wrapper service in place, let’s start capturing some logs in root component:
export class AppComponent implements OnInit {
  constructor(private monitoringService: MonitoringService) { }

  ngOnInit() {
   this.monitoringService.logInfo('App initialised at ' + new Date().toString());
   this.monitoringService.logError(new Error('My bug-free app throws an error'));
   throw new Error('An unhandled exception never happens, really.');
  }
}Code language: TypeScript (typescript)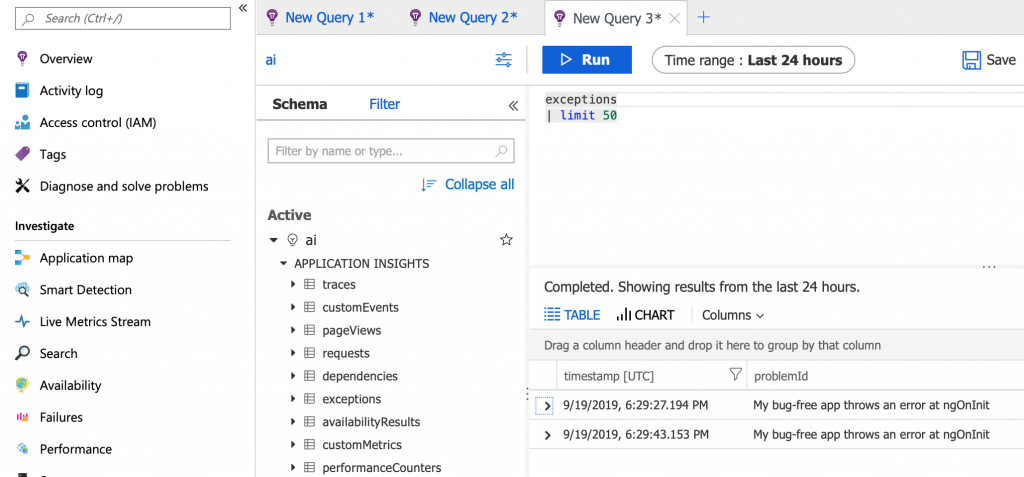
Tracking page views
It may be useful to know which pages are popular amongst users. Assuming your application is using deep links, we can listen to router events and log a page view using the monitoring service.
export class AppComponent implements OnInit {
  title = 'AngularAppInsightsDemo';

  constructor(private monitoringService: MonitoringService,
    private router: Router) { }

  ngOnInit() {
    this.router.events
      .pipe(filter((event): event is ResolveEnd => event instanceof ResolveEnd))
      .subscribe((event) => {
        const activatedComponent = this.getActivatedComponent(event.state.root);
        if (activatedComponent) {
          this.monitoringService.logPageView(activatedComponent.id, event.url);
        }
      });
  }

  private getActivatedComponent(snapshot: ActivatedRouteSnapshot): any {
    if (snapshot.firstChild) {
      return this.getActivatedComponent(snapshot.firstChild);
    }

    return snapshot.component;
  }Code language: TypeScript (typescript)
It helps to have an identifier on your routed components:
export class MyComponent {
  static id = "my important page";
}Code language: TypeScript (typescript)
Logging unhandled exceptions
Application Insights will automatically capture unhandled exceptions. However, this does not work for Angular applications because the framework swallows unhandled exceptions.
In order to capture unhandled exceptions, you must implement a global error handler and use trackException method.
Create a new file in your project, call it global-error-handler.ts and paste the following code:
import { ErrorHandler, Injectable, Injector } from '@angular/core';
import { MonitoringService } from './monitoring.service';
@Injectable()
export class GlobalErrorHandler implements ErrorHandler {
    constructor(private injector: Injector) { }
    handleError(error: Error) {
        const monitoringService = this.injector.get(MonitoringService);
        monitoringService.logError(error);
    }
}Code language: TypeScript (typescript)
The error handler gets the instance of MonitoringService on the fly and logs an error.
In order for this to work properly, we need to provide it in our root module.
  providers: [
    {
      provide: ApplicationInsights,
      useFactory: appInsightsFactory
    },
    {
      provide: ErrorHandler,
      useClass: GlobalErrorHandler
    }
  ]Code language: TypeScript (typescript)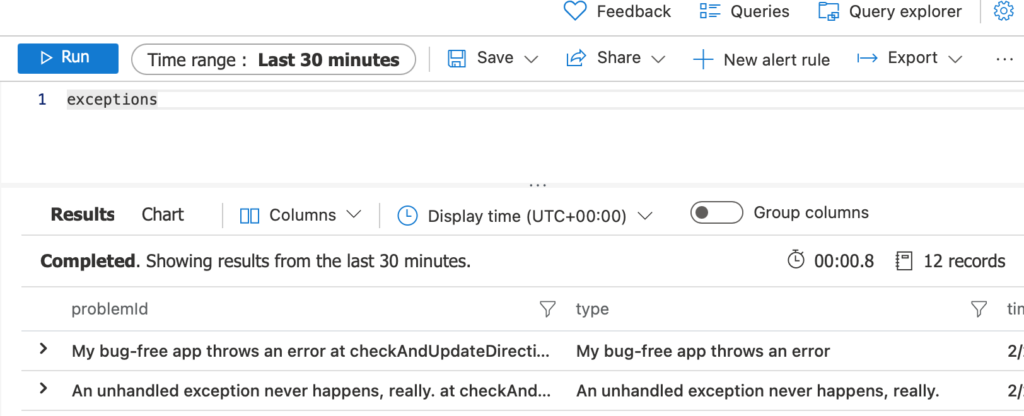
Tracking users
It is important to associate telemetry items with authenticated users. You can achieve this with setAuthenticatedUserContext method, which accepts a user id.
this.appInsights.setAuthenticatedUserContext(userId);Code language: TypeScript (typescript)You would ideally call this function when the user session starts e.g. on successful login.
Just make sure to clear user id when they log out, or whenever the session ends.
this.appInsights.clearAuthenticatedUserContext();Code language: TypeScript (typescript)Summary
There you have it! It is very easy to monitor Angular applications with Application Insights. In this post, I explained how you can get started quickly. Ff you have any questions or suggestions, drop a comment below!

script error: the browser’s same-origin policy prevents us from getting the details of this exception. consider using the ‘crossorigin’ attribute, I’m getting this error in my appinsights how to solve it I know that introducing a crossorigin in script tag will resolve this but I’m having more than 500 tags in my project is there any way to resolve tracking this error in appinsights
Do you have thoughts on whether to use a distinct app insights resource for the Angular side of the app or whether to use a shared app insights resource for both the Angular and API sides?
I would absolutely encourage you to use the same app insights resource for both the API and the UI. This will allow App Insights to capture transactions end to end, including your API dependencies. In addition, the application map feature will illustrate all of the components in your application when you use the same instrumentation key.